What is the proportion of colored balls?
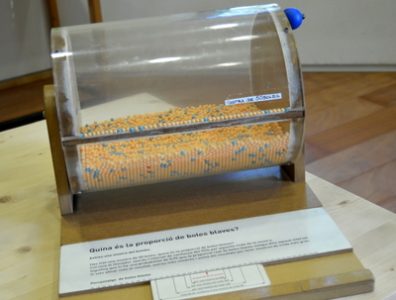
En aquest bombo transparent hi ha boletes de dos colors. Un llistó amb ranura permet recollir una mostra de 50 boletes. La proporció de boles de colors observada a la mostra, és una estimació de la proporció que ens demanen.
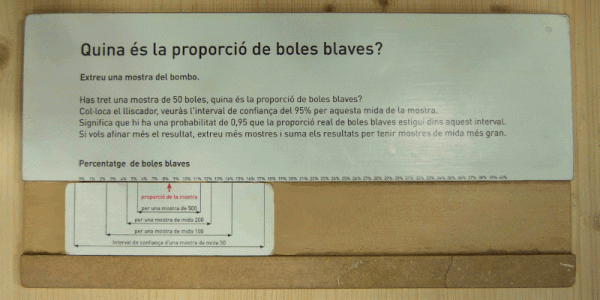
Fent lliscar una peça per tal que indiqui la proporció de la mostra, podem llegir l’interval de confiança del 95%, és a dir entre quins valors està la proporció de boles de color de tot el bombo.
- Ubicació en el museu: Sala Lluís Santaló
- Minimum age: from 12 years old.
- Required time: 5-10 minutes.
- Number of participants: 1 or more if you need help to perform the calculations.


General operation
It is necessary to turn the drum so that the wooden bar is completely full, in this way exactly 50 balls have been selected.
The 50 balls on the bar are our random sample. It is necessary to count how many blue balls there are. If, for example, we have 8 blue balls out of the total of 50, this means that the percentage of blue balls in the sample is 16%. This is an easy mental calculation to do.
Once we have the percentage of the sample or sample proportion, we have moved to the piece of wood attached to the drum, its slider until it indicates this value. Then we can read the minimum and maximum values that it indicates for a sample of size 50. This is the confidence interval where the actual percentage of color balls is located, with a 95% probability.
Let's reflect: The result is really a very large interval. In order to adjust the result more and get a smaller confidence interval we have to work with a larger sample. We can do this with the same drum. We collect 50 balls and add the results. The slider has specified the trust interval for samples of different sizes.
Related concepts
Historical context
In 1937 there are already publications that develop the concept of interval of trust. However, it took a long time to be used accurately and routinely. For example, it was not until 1997 that a trial with a very large set of samples and an acceptable confidence interval was able to ensure that cortisol therapy does not reduce the risk of acute stroke[source].
Guest reviews
Drawing conclusions about data from only a few samples is a process we are used to. It is necessary to be aware that it requires that the characteristic that we study is distributed evenly to the entire population and that we make sure that when taking the sample all the elements have the same probability of being chosen.
As an anecdote, illustrative: in the process of building this module we had to discard a certain remittance of colored balls because they had a slight grip on the walls of the drum.
Applications
From the sample proportions it is relatively easy to approximate the proportions that will be given to the entire population without the need to sample the entire population. This is very useful when it comes to finding the prevalence (proportion) of certain diseases in a country or even worldwide. In this way you can find, for example, the proportion of smokers in a country and make a forecast of the health expenditure they will represent in the future.
Easy reproduction of this module in the classroom
We need a methacrylate box or other transparent material and two-color balls of exactly the same size and characteristics. They can be pearls to make necklaces or bracelets or, like those of this module, projectiles for compressed air shotguns.
The box must be filled approximately half. and seal it with adhesive tape so that it does not open when stirring.
Once we have agitated it we can consider that the sample is the row of balls that have been located along one of the lower edges.
Simulation with a spreadsheet

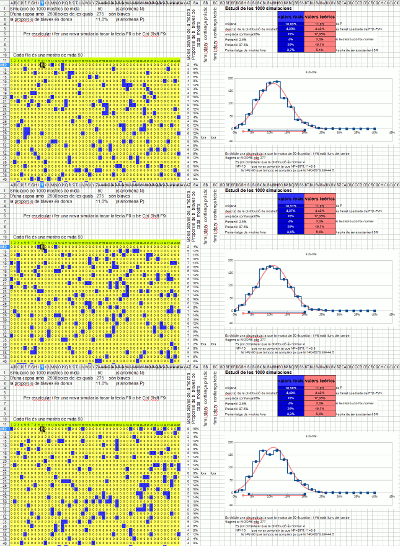
Spreadsheets have the function that generates a random number between 0 and 1, usually their syntax is =RAND(). They also have an option (usually F9) that recalculates the entire sheet and therefore renews all these values. This is based on this spreadsheet (XLS, ODS) where 1,000 extractions of a sample of size 50 are simulated. Of these 1,000 sample proportions, a histogram (in blue) is made that overlaps with the corresponding normal curve (in red). It checks that it fits correctly and therefore justifies the width of the trust range used in the slider.
