No te’n vagis massa lluny!
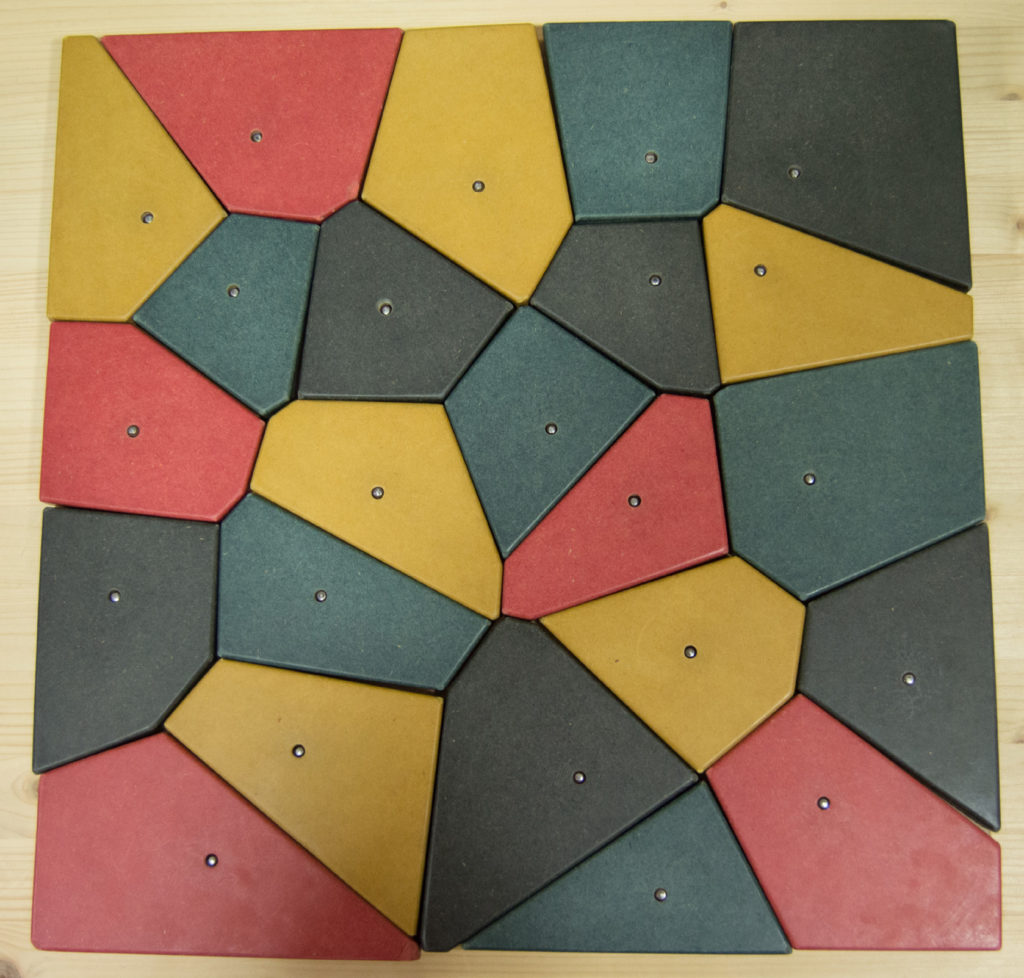
Completa el tauler sabent que cada peça acaba en la mediatriu
entre dues clavilles i que dos colors iguals no es toquen.
This is a division of the plane into regions called the Voronoi diagram (Russian-Ulcraine mathematician 1868-1908).
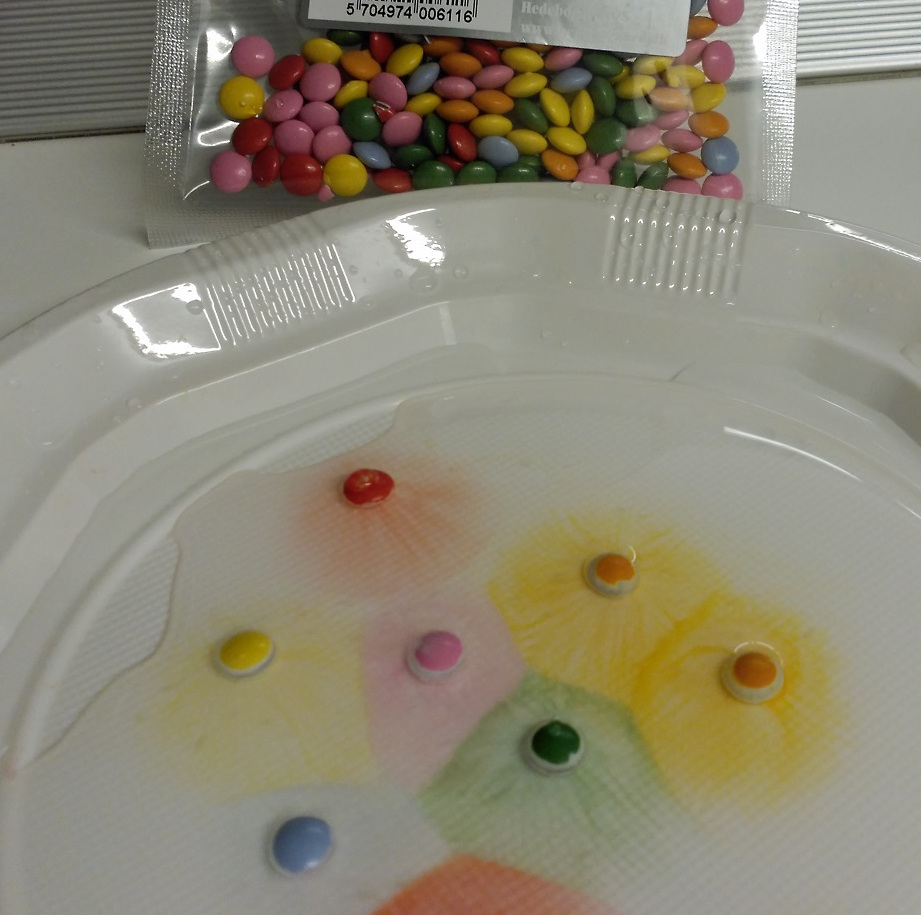
Given a set of points (in our case the pegs) the regions are formed by the points closest to each peg.
If there are only 2 points the set of points at the same distance of the two forms a line, it is the mediatry of the segment that joins the 2 points.
The mediatry of a segment is the line perpendicular to the segment passing through its midpoint.
- Location:
- Minimum age: from 6 years old.
- Required time: 5 minutes.
- Number of participants: One or more people
- Keywords: Minimum distance, equidistance, proximity, mediatry, straight, border
- Taxonomy: GEometry

Practical applications
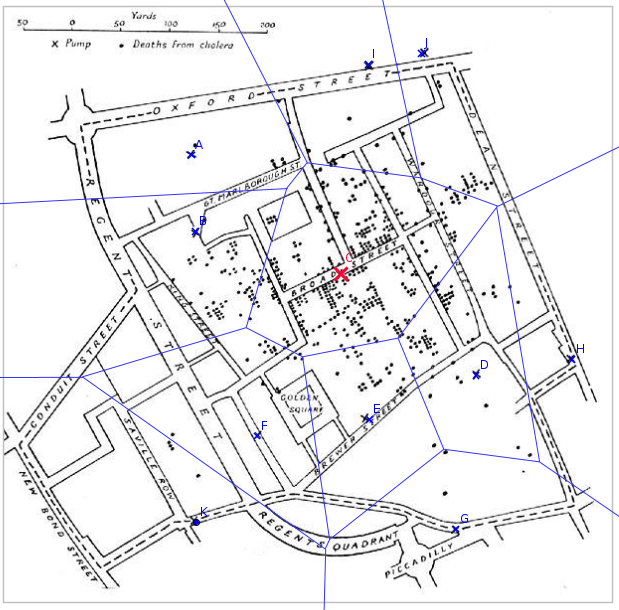
In 1854, the British physician John Snow informally used Voronoi diagrams to illustrate how most people who died from a cholera outbreak in London lived closer to the infected water pump than any other.
Voronoi regions are an instrument used to manage the distribution of telephone antennas, pharmacies, hospitals, airports or any other service in a territory.
In meteorology it is used to determine areas of precipitation, based on rain gauge data, in this application they are called Thiessen polygons.
They are also used in geology, ecology, economics, and in general, in any area with a problem of proximity or study of areas of influence.

The original map by J. Snow on which the areas of influence of each water point have been drawn with GeoGebra .
Material descarregable i en línia.
Proposta de treball a l’ARC “INVESTIGUEM LA TAXIGEOMETRIA” de Guillem Bonet i Mireia Pacreu

